
Graph Logs
This is a forked and heavily updated version of MightyMooquack's Time Series Graphs mod, which was migrated to Factorio 1.1 by Nes_p's mod who didn't change anything. Many thanks also to JamieNyanchy's Pollution Combinator for inspiring the many hours of effort in porting and developing this mod.
Changes from the Original
- Output Types: The first button at top-left, switches between the different output modes. Each game tick, a signal's value is read and stored, this counts as one. The modes show, for the current interval, the total value, total count and total average (aka rate) - value divided by count.
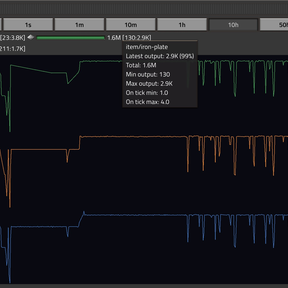
- Top Row Signals: From left to right per each tile, an icon of the signal, a progress bar matching the last read output between the interval's minimum and maximum; the selected total output for the current interval, and the actual minimum and maximum signal values.
- Graphs: The graphs have been reverse-engineered to display the maximum and minimum points still within the window. Chose to replace the miss of a signal with the minimum interval output. There are now two types of graphs too, the original, overlayed one and a new one - each signal set on a separate lane, this helps with binary-like signals when using the Pulse signal output.
- New Appearance: The images have been revamped (using an HSL filter) and rebranded, as the original sources appeared too outdated for contemporary trends. This also helps delineate how different this mod is from its predecessor.
- Other Minor Fixes: Too numerous to recall. For example, the signals are now fixed as colors and positions across the different intervals, for easier tracking.
Limitations
Viewing the signals, i.e. opening the GUI of a sensor, is not working on space platforms.
Migration
Migration from earlier versions is most likely not possible due to the many changes introduced by Factorio 2.0's Space Age API, as well as the features and updates implemented in this version.
Performance Notes
For each placed combinator logging four signals, approximately 20 microseconds are spent per tick. Displaying a plot of a duration of one minute or longer consumes up to around 7 milliseconds every 6 ticks (for the 1-minute interval) or every 30 ticks (for longer intervals). On average, this results in less than 1 millisecond per tick when viewing the plot.
Future
Development will be decided on the go as this Factorio: Space Age single playthrough progresses.